Global Investment Activity
April 14th 2018 | , Urban Property Australia
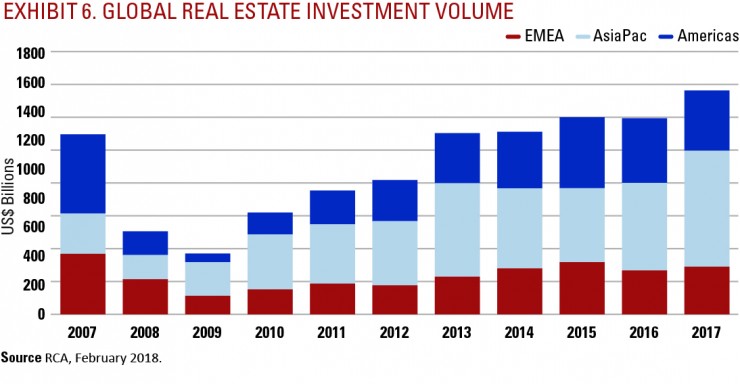
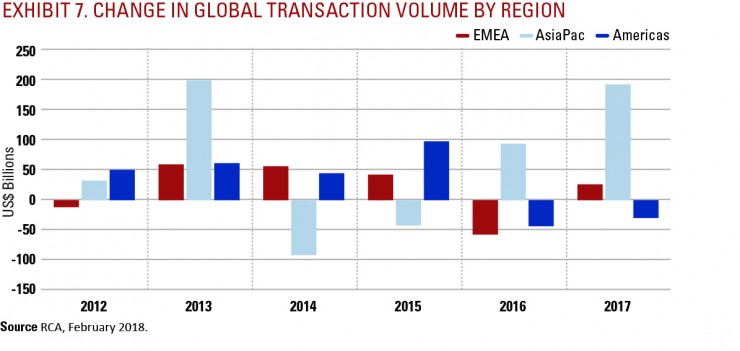
As shown in Exhibit 6, global commercial real estate investment (sales of $10 million or greater) totalled $1.5 trillion in 2017, up 14% from 2016, according to Real Capital Analytics (RCA). Most of the growth occurred in the Asia Pacific region (see Exhibit 7), which grew by 32% last year, led primarily by strong investment in Hong Kong and Singapore. The Europe, Middle East and Africa (EMEA) region came in second growing at approximately 9%, and was led by large European deals involving portfolios, mergers and acquisitions, and large single-property sales.
Slower transaction volume in the US weakened investment growth in the Americas, which fell nearly 7% in 2017. Transaction activity (on deals greater than $2.5 million) in the US slowed in 2017, with volume falling nearly 5% to $471 billion. Persistent concern over the age of the US economic expansion, which is in its ninth year, has created a pricing gap between sellers and buyers. This has hindered deal flow as buyers are hesitant to purchase at such low cap rates this late in the real estate cycle. An area of growth across all of the regions was land sales. Developers were extremely active in Asia Pacific, especially China, and development site activity also grew in both the EMEA and Americas.


Among the top 20 global trade routes, half of the investment destinations were either to the US or the UK, as shown in Exhibit 8. In terms of outgoing investment, US investors were responsible for the top three routes. Germany was the top destination for US investment, followed by Spain which was buoyed by a 433% increase in US money into the country in 2017. The UK was the third ranked destination for US investment. Finland moved swiftly into the top 10 of global trade routes, after experiencing a 2,093% increase in US investment in 2017 on the back of Blackstone Group’s $2 billion acquisition of Finnish real estate firm, Sponda.
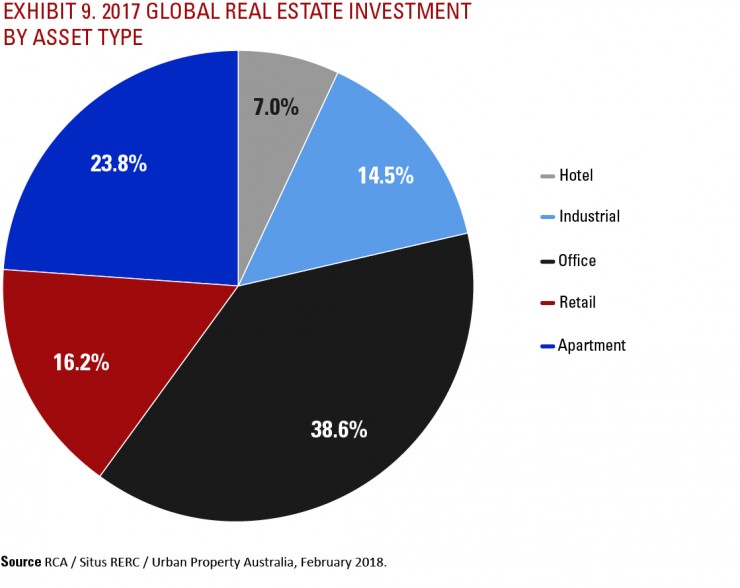
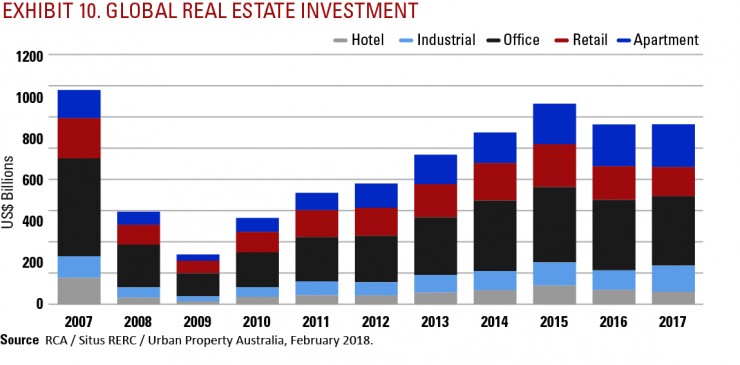
At almost 39%, office continued to account for the largest percentage of global real estate investment in 2017 (see Exhibit 9). While retail ranked third in share of global real estate investment in 2017, retail’s share of global investment has declined for the last six consecutive years. Apartment surpassed retail’s investment share in 2016, and industrial is expected to overtake retail in 2018 or 2019. Among the property types, industrial outperformed all sectors in the Americas and EMEA, and continues to be a key trend in global real estate investment. As more companies revise their global supply chain management strategies to fit online retailing, demand for logistics warehousing has continued to increase.
The Global Cities Composite of the RCA Commercial Property Price Index (CPPI) increased 1.2% in 4Q 2017 signalling a slowing of price appreciation in 4Q 2017 from the levels recorded in the first three quarters of the year. However, led by strong increases in Asia Pacific and continental Europe, the Global Cities Composite for the entire year was up 8.4% over 2016, as shown in Exhibit 10. Pricing triggered a drop in investment activity in the traditional global cities in 2017, as investors found it more difficult to find core assets in the world’s top investment markets. Investors in search of yield instead sought to deploy capital in alternative locations, leading to an uptick in acquisitions from both domestic and cross-border investors into secondary markets.


Special Recognition
The sponsoring firms (Situs RERC & Urban Property Australia) would like to express their deep gratitude for Real Capital Analytics (RCA) for providing transaction volume and capital flow data during the completion of this report. All investment activity data comes from data provided by RCA. For more information about RCA’s data services, visit www.rcanalytics.com.


