Q3 2019 – Melbourne Residential Market
October 22nd 2019 | , Urban Property Australia
- Melbourne home value index has risen by 3.5% over the September 2019 quarter with signs of further strengthening;
- Vacancy rate for Melbourne residential property remains tight at 2.1%, leading to solid rental growth;
- Victorian dwelling approvals continue to decline to now be 22% than last year and its lowest level in five years;
- Improving consumer confidence levels have been reflecting by higher clearance rates with current levels of 77% significantly higher than the 50% levels a year earlier.
Residential Market Summary
The housing market has made further progress towards a recovery, with CoreLogic’s national home value index recording a third consecutive month of gains led by the Sydney and Melbourne markets. Following APRA’s easing of lending restrictions in May 2019 and multiple interest rate cuts made by the RBA, housing finance levels have jumped which Urban Property Australia expects will support housing values for the short term.
Prices
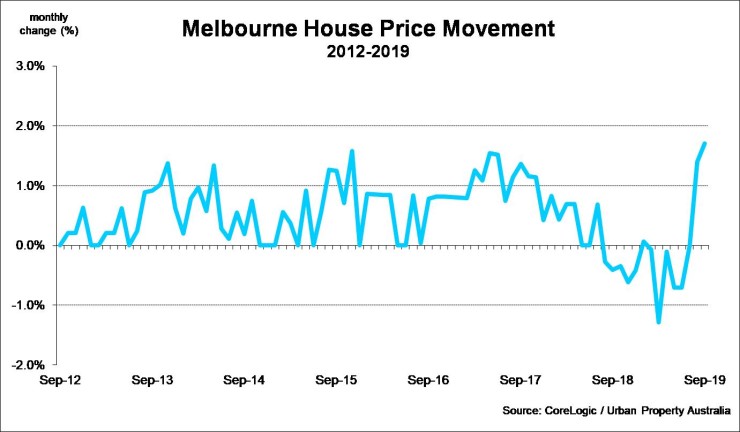
The housing market has made further progress towards a recovery as highlighted by CoreLogic’s national home value index recording a third consecutive month of gains to September 2019. Since the trough of May 2019, the CoreLogic home value index has increased by a cumulative 1.7%. Although the index remains below 6.8% below the October 2017 peak, driving the lift in has been the strength of the Sydney and Melbourne housing markets. Over the year, dwelling values are lower across six of the eight capital cities, with Hobart values 2.5% higher and only Canberra values 1.3% higher than September 2018 levels.
According to CoreLogic, values of detached houses in Melbourne have fallen by 5.9% in the 12 months to September 2019 with apartment prices more resilient being 1.6% higher over the year. Urban Property Australia considers that the improvement in credit availability will support housing values and that Melbourne’s economic and population growth will boost the recovery of the residential market, albeit with gains at a more sustainable growth rate.

Supply
Impacted by the tighter lending environment, according to the ABS, as at June 2019 there were 70,100 dwellings currently under construction across Victoria, 4% lower than the peak of 73,100 in early-2018 but still 30% above the 10-year average.
Looking even further ahead, reflecting the difficulty in developers sourcing development finance coupled with the soft environment of pre-sales, the level of dwellings approved continues to decline. In the 12 months to August 2019, a total of 58,400 dwellings were approved in Victoria, 22% lower over the preceding year. The number of dwelling approvals in Victoria has now fallen to its lowest level since October 2014. The decline in dwelling approvals was driven by the apartment market with approval levels down 35%. In contrast approvals for houses fell by 10% in the 12 months to August 2019. Signalling the changing preferences of purchasers, approvals for houses now account for 61% of all dwellings while townhouse developments account for 21% of total approvals across Victoria, as first home buyers continue to grow market share compared with houses accounting for 74% in 2008.
Demand
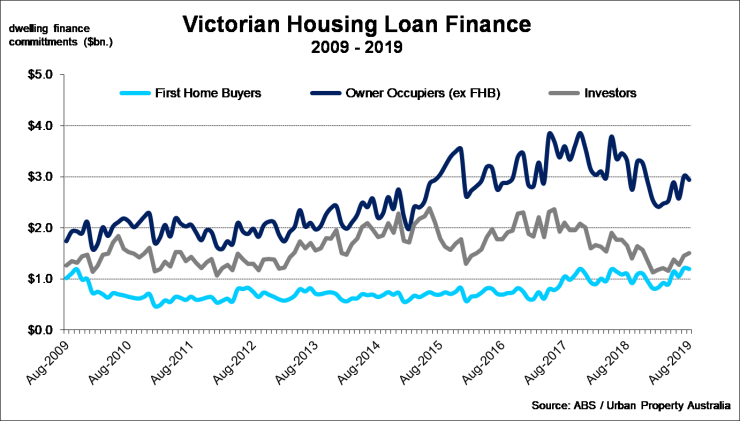
Demand for Melbourne residential property continues to recover following APRA’s easing of lending restrictions in May 2019 coupled with the RBA rate cuts in June, July and October. Having fallen to seven-year lows as at May 2019, volume of Australian housing loans has increased for three consecutive months. As at August 2019, monthly owner occupier finance in Victoria has increased 2.4% with investor lending up 9.8% since May 2019. First home buyers are also becoming more active having increased by 8.5% over the year and now account for 21% of all finance commitments, significantly higher than their proportion of 11% in 2016.
Mirroring the increasing housing finance loan activity and improving consumer confidence levels, the auction market has also strengthened. Although the number of auctions remains below the levels last year, across Melbourne the clearance rate increased to 77%, compared to 50% a year earlier.

Vacancy
According to the REIV, as at August 2019, the vacancy rate for Melbourne residential property remains tight at 2.1%, slightly up from 2.0% in August 2018. Within Melbourne’s sub-regions, vacancy rates in the inner suburbs declined 10 basis points over the year to reach 1.8%. Vacant dwellings in the city’s outer suburbs was also tight at 1.8/% with the middle suburbs increasing 50 basis points over the year to 3.2% as at August 2019 (but lower than the recent peak of 3.7% in April 2019). Outside of the metropolitan area, in regional Victoria vacancy increased by 10 basis points over the year to 1.5% as at August 2019. Vacancy rates in all the key regional cities of Bendigo, Geelong and Ballarat all remain below 2%.
Rents
According to the REIV, over the year to August 2019 the weekly median rent for houses in metropolitan Melbourne remained steady at $450 per week, while in regional Victoria, the weekly median rent for houses increased by 6.3% increasing to $340. The weekly median rent for units increased in metropolitan Melbourne to $430 per week rising by 2.4% over the 12 months while the median rent for units in regional Victoria increased by 7.7% to $280 per week over the year to August 2019. Across Melbourne precincts weekly median rent were largely stable over the year to August 2019 with the Inner precinct outperforming other regions. For regional Victoria, Ballarat outperformed both Bendigo and Geelong with the weekly median rent for houses up 6% to $333 as at August 2019.
Copyright © 2019 by Urban Property Australia All rights reserved. No part of this publication may be reproduced in any form, by microfilm, xerography, electronically or otherwise, or incorporated into any information retrieval system, without the written permission of the copyright owner.


