Asia Pacific Investment Activity
April 14th 2018 | , Urban Property Australia
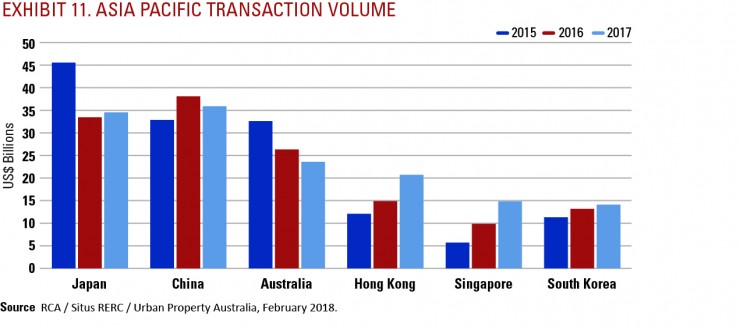
Investors faced a fully priced, highly competitive environment throughout Asia Pacific during 2017. Property yields hovered at historic lows in markets such as Japan, South Korea and Hong Kong, or compressed to new lows, as in Australia and Singapore. Commercial real estate investment in Asia Pacific totalled $157 billion in 2017, up 6% from 2016 levels, according to RCA.
Commercial real estate investment reached an all-time high in Asia Pacific in 2017. Growth was led by activity in Singapore, South Korea and Hong Kong.
The office and retail sectors, which have traditionally been a key target for investors, underperformed relative to other property types in 2017. The unwillingness of existing owners to sell and rapidly increasing prices spurred investors to move to other asset classes. Transactional activity in the office and retail sectors was stable compared to 2016.
Positive changes in the sector due to e-commerce, as well as robust growth in industrial fundamentals captured investors’ attention in 2017 and acquisition volume grew by 20%. The industrial sector represented 73% of transactional activity across the Asia Pacific in 2017, up from only 10% in 2016. Sweeping trends such as the urbanisation of Asian cities and expanding e-commerce has reshaped the warehousing sector and supply chain throughout the region.


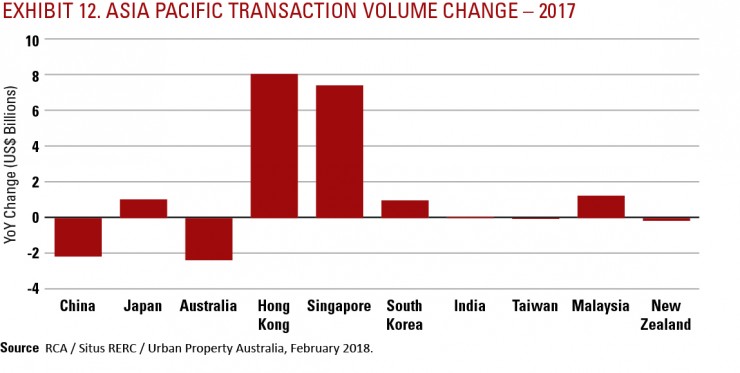
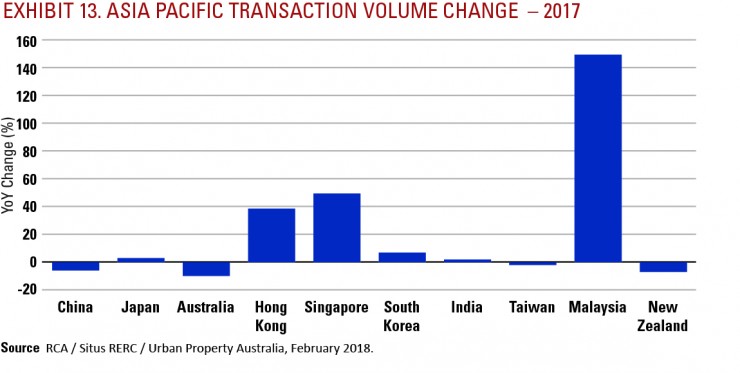
Investment activity for income-producing properties in Asia Pacific stayed focused on China and Japan; combined, they represented 45% of investment activity for standing assets in the region. China retained its crown as Asia Pacific’s largest market for commercial real estate investment in 2017, even as transactional activity edged down 6% to $36.2 billion. In Japan, Asia’s second largest market, investment rose 3% to $34.9 billion (as seen in Exhibits 12 and 13).
Cross-border Asian investors in the region grew over 2017. Both Singaporean and Hong Kong investors increased their allocations across the region while Chinese capital declined marginally from record levels achieved in 2016. South Korea was another Asia Pacific market that reached a new peak in 2017, with a 7% increase in transactional activity to $14.3 billion.
Among the Asia Pacific metros, Beijing ranked number one in total transaction volume among all Asia Pacific metros ($48.5 billion), as well as number one in YoY growth (120%). Hong Kong and Singapore rounded out the top three in terms of total volume and YoY growth. Sydney, ranked 6th out of 11 Asia Pacific metros and is the only Australian metro to outrank a non-Australia Asia Pacific metro (Seoul).

Investment activity in Hong Kong broke records in 2017. Acquisitions of income-producing assets grew 39%, underpinned by domestic purchasers. Scarcity of land and a flood of capital from mainland China were the main reasons for the surge in activity.
In China, capital shifted to the regional cities. Transactional volume increased in the majority of tier 2 and 3 cities such as Nanjing, Chengdu, Wuhan and Chongqing. In Guangzhou, transactional volume increased 157% over 2017.
Tokyo investments underperformed relative to acquisitions in other cities. Top pricing for office and retail assets in Tokyo persuaded investors to switch to higher-yielding assets in regional cities such as Yokohama and Osaka.
Many investors looked for opportunities in frontier markets because of favourable economic conditions and maturing real estate markets. Cambodia, Indonesia, Malaysia and Thailand all experienced triple-digit year-over-year growth, albeit starting at low levels. India – the largest of the frontier markets – recorded $3.5 billion of commercial real estate asset sales in 2017.
Special Recognition
The sponsoring firms (Situs RERC & Urban Property Australia) would like to express their deep gratitude for Real Capital Analytics (RCA) for providing transaction volume and capital flow data during the completion of this report. All investment activity data comes from data provided by RCA. For more information about RCA’s data services, visit www.rcanalytics.com.


