Melbourne Residential Market Mid 2017
July 5th 2017 | , Urban Property Australia
Tighter macro-prudential regulation, changing government policy and out of cycle rate hikes are all weighing on consumer sentiment with house prices plateauing over the past three months with unit prices falling.
Prices
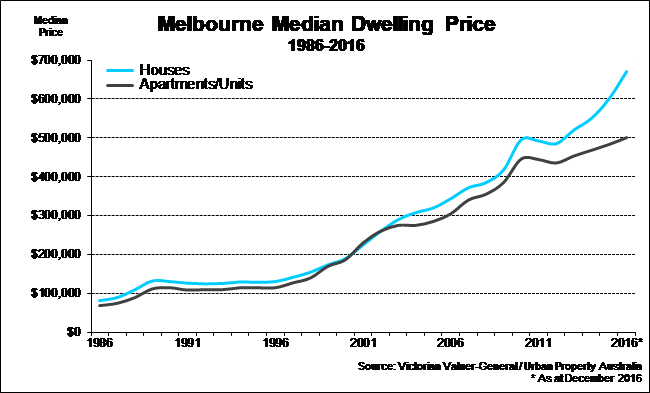
According to Core Logic RP data, house price data for May posted its weakest result in 18 months, with prices falling 1.1% nationwide. The weakness in prices was driven primarily by the unit/apartment sector, where prices fell 1.7% nationwide. Of particular note is the fact that both Brisbane and Melbourne’s unit prices are now lower than a year ago. Brisbane unit prices have been declining for some time, and the fall has gathered pace to sit at 4.6% lower over the year to May 2017. On the other hand, unit prices in Melbourne have cooled rapidly from their peak of May 2016.
Prices of detached houses in Sydney have plateaued over the past three months, and annual growth in Sydney and Melbourne has suddenly slowed to 12.1% and 12.8% respectively.
Looking forward, national median prices are expected to increase by between 2% and 4%, with population growth slowing, higher mortgage rates for investors and continued uncertain economic conditions.
Interestingly, according to the REIV, Melbourne’s median house price has recorded its strongest quarterly price growth since 2013, breaking the $800,000 barrier for the first time. The Melbourne median house price increased 7.6% in the first three months of 2017 to a record high $826,000 – up more than $55,000 on December 2016. Price growth was also recorded in the apartment sector with the metropolitan Melbourne median unit price increasing 3.8% to $583,000.
All sub-regions of Melbourne experienced annual house price growth led by the Inner suburbs, which grew by of 10.8% in the year to April 2017 followed by Outer (9.2%) and Middle (5.7%) suburbs.

Supply
According to recent building activity data released by the Australian Bureau of Statistics as at the December 2016 quarter, while still above the long-term average, the number of apartments and houses under construction have begun to ease from record-levels set in mid-2016. In the December 2016 quarter, 28,289 houses commenced construction, once again overshadowing the 27,289 figure recorded for apartments. Over the 12 months to December 2016 in Victoria, 65,789 new apartments commenced construction with 36,198 houses commencing construction.
Looking even further ahead, residential building approvals fell sharply in May, offsetting the previous month’s increase. The monthly fall was driven by the apartment segment, with New South Wales and Queensland posting 30% declines. The sum of approvals of high rise apartments for the year to May in New South Wales, Victoria and Queensland are now 28%, 28% and 45% lower than their respective annual peaks across 2015 and 2016. Building approvals are expected to fall a further 5-10% in the current cycle.
Given the challenges in securing enough pre-sales to trigger the commencement of some projects, some projects will not begin construction while there is also some risk that some apartments purchased off the plan have the prospect of negative equity for some buyers.
Demand
Housing finance commitments fell in April, with a sharp fall in the investor segment, impacted by the introduction of additional macro prudential regulation by APRA in late March. While investor loans fell by 2.3% in April, they still remain however 14.1% higher over the year. Owner occupier loans continue to ease and now have fallen by 6.4% over the year to April 2017. By state, owner occupier approvals are still up on a year ago in NSW (8.4%) and Victoria (5.7%) with lower levels recorded in Queensland (-0.7%) and WA (-11.9%) over the year. More recent data from weekly auction activity suggests that housing market conditions in Melbourne and Sydney have continued to cool in May and early June.
Vacancy
According to the REIV, as at May 2017, the vacancy rate for Melbourne residential property fell to 2.2%, from 2.9% in May 2016. Within Melbourne’s sub-regions, vacancy rates in the inner suburbs tightened 50 basis points over the month to 2.0%. Vacant space in the city’s middle also fell, decreasing by 60 basis points to 3.0% with the outer suburbs contracting 30 basis points to 1.9%. Outside of the metropolitan area, in regional Victoria vacancy decreased by 40 basis points over the year to 2.4% as at May 2017. Vacant rental space decreased in all the key regional cities over the year with Bendigo, Geelong and Ballarat all recording falls in vacancy over the year to May 2017.
Rents
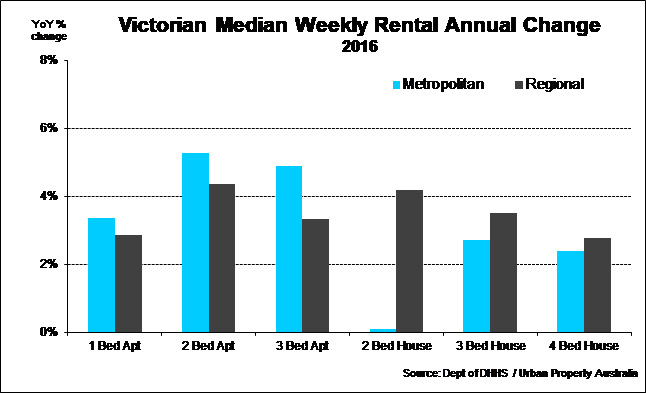
According to the REIV, over the year to May 2017 the weekly median rent for houses in metropolitan Melbourne increased by 6%, rising to $425 per week, while in regional Victoria, the weekly median rent for houses increased by 6.9% increasing to $310. The weekly median rent for units increased in metropolitan Melbourne to $400 per week rising by 2.6% over the 12 months while the median rent for units in regional Victoria remained stable at $250 per week over the year. Melbourne’s middle suburbs recorded the city’s largest growth in weekly median rent for houses, increasing 7.5% over the year to May 2017, up to $430. For regional Victoria, Geelong was the main growth driver with the weekly median rent for houses up 15.6% to $370 as at May 2017.


