Melbourne Residential Market– July 2018
July 25th 2018 | , Urban Property Australia
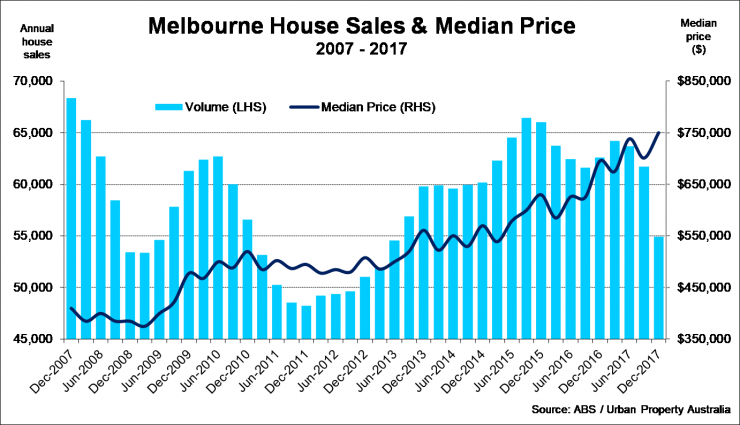
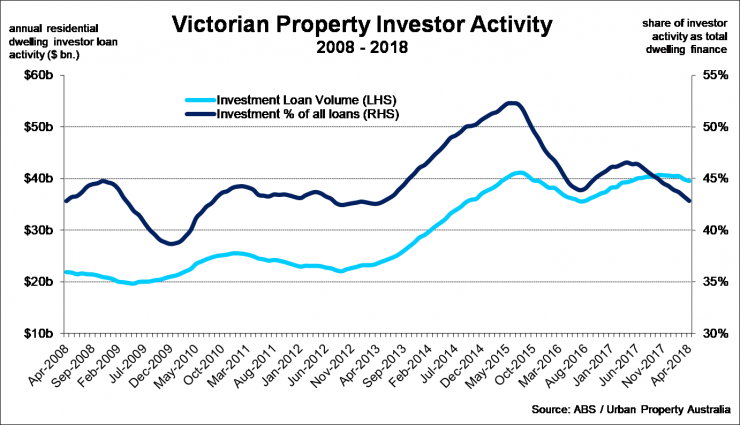
While the Melbourne residential market has been resilient so far, there are emerging signs of the market softening; with prices easing, falling transactional volume and declining investor activity.
Prices
According to CoreLogic, Australian dwelling values slipped 0.2% lower in June 2018, taking the annual change (-0.8%) the first annual decline of values since October 2012. In a sign the housing market downturn is becoming more entrenched, June 2018 marked the ninth consecutive month-on-month fall since the national market peaked in September 2017, taking the cumulative fall in dwelling values to 1.3% through to the end of June 2018.
Melbourne has taken over from Sydney as the weakest performing housing market over the three months to June 2018. Dwelling prices in Melbourne have declined by 0.4% over June 2018 to be 1.4% lower over the three months to June; the largest decline in Melbourne dwelling values over a three-month period since February 2012.
According to CoreLogic, prices of detached houses in Melbourne have fallen by 2.3% in the 12 months to June 2018 with apartment prices 0.3% lower over the year to June 2018.
Looking forward, declining sales volumes reflect the overall cooling demand for residential property. According to CoreLogic, the volume of Melbourne house sales has fallen by 13.2% with apartment sales down 12.4% in the year to May 2018. This slowing demand is likely to affect prices with UPA research predicting residential values to remain stable though to 2020.

Supply
While still above the 10-year average, the number of apartments and houses under construction in Victoria have begun to ease from the record-levels of late-2016. According to recent building activity data released by the Australian Bureau of Statistics as at the December 2017 quarter, there were 64,222 new dwellings under construction, accounting for 29.7% of Australia’s current pipeline of new residential development. Interestingly, while the number of apartments under construction in Victoria has fallen over since mid-2016, the number of houses under construction has steadily increased. As at December 2017, houses accounted for 34.1% of all dwellings under construction in Victoria, the highest proportion since June 2014.
Looking even further ahead, Victoria has overtaken New South Wales as the state with the highest number of residential building approvals, reflecting the State’s nation-leading population growth. In the 12 months to April 2018, 74,316 dwellings were approved in Victoria of which 52% were for detached housing. Townhouse approvals have increased significantly over the past 12 months, up 23%, as developers focus on medium density development with most of these approvals located in middle-ring Melbourne suburbs. The number of dwellings approved in high-density apartment developments also increased in the year to April 2018, however given the tightening lending conditions many of these projects will not proceed.
Demand
Housing finance commitments in Victoria continued to increase, having risen by 9.4% in 12 months to April 2018, led by owner occupiers. Impacted by APRA driven measures to tighten investor lending, investor loans increased by only 0.6% over the year to April 2018. While investor loans continue to increase, their levels remain below the peaks of mid-2015. Interestingly, the proportion of investor loans of total borrowing has fallen to 42.8%, its lowest level since April 2013. In contrast, first home buyers are becoming more active. The share of first home buyers of total housing finance commitments in Victoria has risen to 17.9% as at April 2018, its highest level since April 2014.
The 2018 auction market so far has demonstrated the weakening property market, with the success rate of auctions continuing to fall through the first half of the year; returning the lowest weekly clearance rates seen since 2012. As at June 2018, the clearance rate of Melbourne auction fell to 60%, down from 70%, a year earlier.

Vacancy
According to the REIV, as at May 2018, the vacancy rate for Melbourne residential property fell to 2.0%, from 2.2% in May 2017. Within Melbourne’s sub-regions, vacancy rates in the inner suburbs tightened 20 basis points over the year to 1.8%. Vacant space in the city’s outer suburbs was the lowest of all sub-regions at 1.7% with the middle suburbs decreasing 20 basis points over the year to 2.8% as at May 2018. Outside of the metropolitan area, in regional Victoria vacancy decreased by 80 basis points over the year to 1.6% as at May 2018. Vacant rental space decreased in all the key regional cities over the year with Bendigo, Geelong and Ballarat all recording falls in vacancy over the year to May 2018.
Rents
According to the REIV, over the year to May 2018 the weekly median rent for houses in metropolitan Melbourne increased by 3.5%, rising to $440 per week, while in regional Victoria, the weekly median rent for houses increased by 3.2% increasing to $320. The weekly median rent for units increased in metropolitan Melbourne to $420 per week rising by 5.0% over the 12 months while the median rent for units in regional Victoria remained stable at $250 per week over the year to May 2018. Melbourne’s middle suburbs recorded the city’s largest growth in weekly median rent for houses, increasing 4.7% over the year to May 2018, up to $450. For regional Victoria, Bendigo outperformed both Ballarat and Geelong with the weekly median rent for houses up 6.8% to $315 as at May 2018.


