Mid Year 2019 – Sydney Commercial Property Market
August 5th 2019 | , Urban Property Australia
- With Sydney house prices down by around 15% from their peak, the NSW economy has moderated
- Sydney office investment volume in 2019 is on track to achieve a new record high
- NSW based retail assets have accounted for 44% of retail transactions across Australia in 2019
Economy
A key factor in the State’s economic growth is Sydney’s housing market, however with prices down by around 15% from their peak in mid-2017, the resulting impacts on New South Wales’ economy have been widespread. The New South Wales (NSW) economy grew by 2.1% in the year to March 2019, down from 3.9% a year earlier. While economic growth has moderated over the last year, this is likely to be temporary. Solid fundamentals, led by exceptionally strong labour market conditions, and a wave of policy stimulus are expected to see a return to growth of 2.5% in 2020/21. The State’s unemployment rate has trended down since 2014 with its current low of 4.6% below the 10-year average and Sydney’s unemployment rate even lower at 4.2%. Having been re-elected in March 2019, the state Liberal-National Coalition government has announced plans to spend $89.7 billion on public infrastructure over the next four years which will support an estimated 107,000 jobs directly and indirectly each year.

Office Market
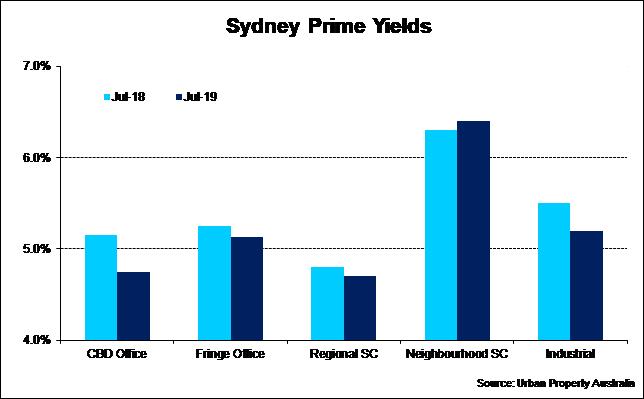
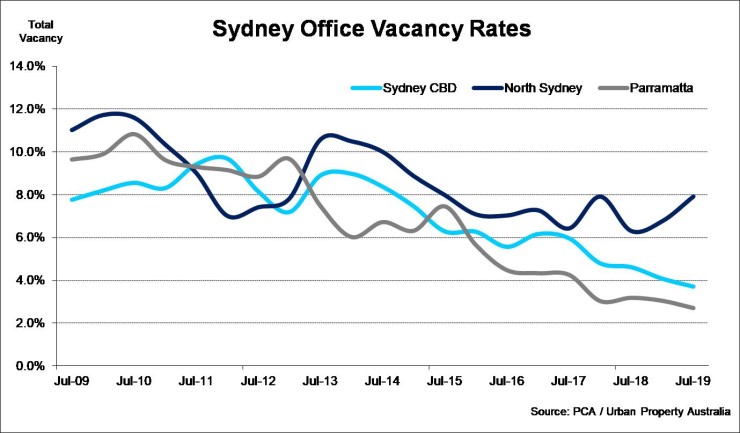
With no new supply delivered to the CBD in 2019 to date, coupled with more than 32,000 square metres withdrawn from the market, the Sydney CBD vacancy rate dropped from 4.1% to 3.7% as at July 2019, the lowest rate since January 2008. New supply is anticipated to remain low over the next 12 months with the total office stock in the Sydney CBD having actually declined by 2.3% over the past two years. Flexible and co-working tenants will continue to dominate the Sydney CBD office leasing market, increasing their presence with estimates that the sector now accounts for 2.6% of Sydney CBD’s total office space. On the back of limited availability and 10-year low vacancy rates, face rents continue to rise in the Sydney CBD. Over the year to July 2019 prime gross face Sydney CBD office rents have increased by 11%. As a result of persistent rental growth and limited vacant contiguous options, increasingly tenants are exploring other office markets. Outside of the CBD, while the vacancy rate of the Parramatta office market declined to 2.7% – an all-time low while the North Sydney office market increased to 7.9% following the completion of 100 Mount Street. Investment volumes in 2019 are on track to record the highest annual volume ever, with Urban Property Australia having already recorded $4.3 billion of office property transacted this year to date. Domestic purchasers continue to outweigh offshore buyers with competition for assets maintaining yield compression. Over the year to July 2019, prime Sydney CBD office yields compressed by 40 basis points to now average 4.75%, well below the previous trough of 5.40% in 2007.

Industrial Market
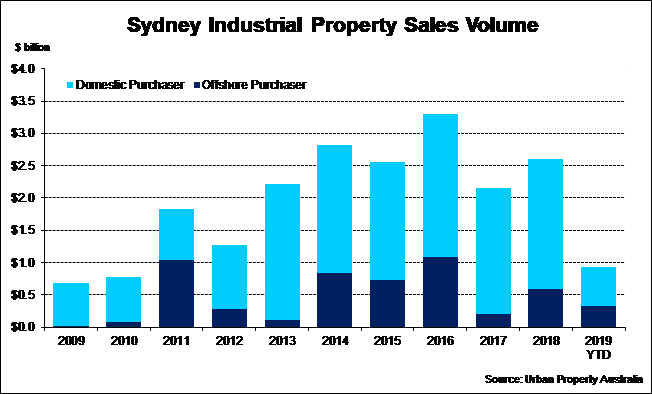
With $61.4 billion of infrastructure transport projects currently under construction across the state, NSW accounts for 47% of all transport projects currently in progress across Australia. Upgrades to transport networks across Sydney continue to create new opportunities, boosting tenant demand, especially for the Western Sydney region. New infrastructure and improving supply chain efficiencies has resulted in tenant demand levels above the 10-year average. Urban Property Australia analysis of leasing transactions in the Sydney industrial market revealed that retail trade and third-party logistics occupiers continue to underpin tenant demand, accounting for 70% of all leasing transactions over the year to July 2019. In addition to elevated tenant demand, the strong pipeline of infrastructure across Sydney has driven new supply with Urban Property Australia projecting that more than 800,000 square metres will be delivered in 2019, the highest annual level since 2008. Strong investor demand coupled with the solid market fundamentals has supported investment activity with $925 million transacted in 2019 to date, accounting for 41% of industrial transactions across Australia in 2019. Offshore investor activity in the Sydney industrial market remains strong, accounting for 35% of all transactions in 2019 to date, their highest proportion of sales since 2011. Despite already being at all-time lows since 2017, UPA estimate average prime Sydney industrial yields at 5.20% as at July 2019, compressing by 30 basis points over the past year.

Retail Market
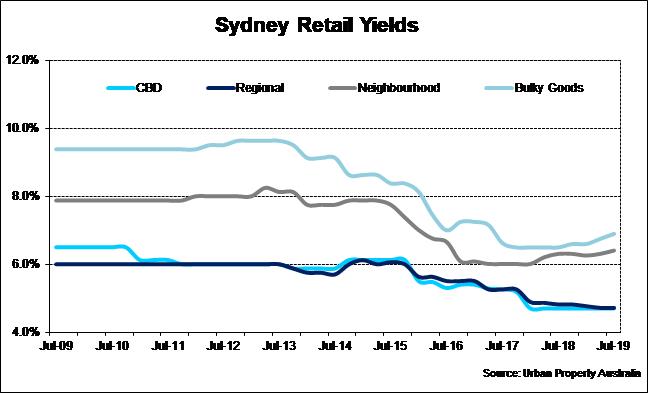
Soft household income growth and a slowing housing market has impacted retail trade in NSW. Over the 12 months to May 2019, NSW retail sales grew by only 0.5%, the lowest annual rate of growth since 2012. Despite the softness of the broader retail market, the ongoing tourism boom continues to drive the growth of luxury retailers in Sydney. Over the year to March 2019, Sydney attracted more than four million international visitors for the first time. Supported by strong demand for prime locations in the CBD, gross face rents continued to grow. Pitt Street Mall continues to hold the record as the most expensive retail location in Australia with gross face rents ranging between $12,000 and $22,900 per square metre. Although Sydney’s CBD retail overall vacancy remained stable at 8%, the current level continues to be elevated compared with the long-term average of 4%. Over 2019 to date, Urban Property Australia recorded more than $995 million of retail property transactions in NSW, the most active retail market in Australia accounting for 44% of retail transactions across Australia in 2019. Reflecting the appetite of investors, yields for neighbourhood and large format centres have eased whereas yields compressed for Sydney CBD retail assets and regional shopping centres have compressed over the year to July 2019.

Copyright © 2019 by Urban Property Australia All rights reserved. No part of this publication may be reproduced in any form, by microfilm, xerography, electronically or otherwise, or incorporated into any information retrieval system, without the written permission of the copyright owner.


