Q3 2021 – Melbourne Retail Market
October 26th 2021 | , Urban Property Australia
- Investment activity in the Victorian retail property sector has already surpassed $1.7 billion in 2021 to date, 15% above the five-year average;
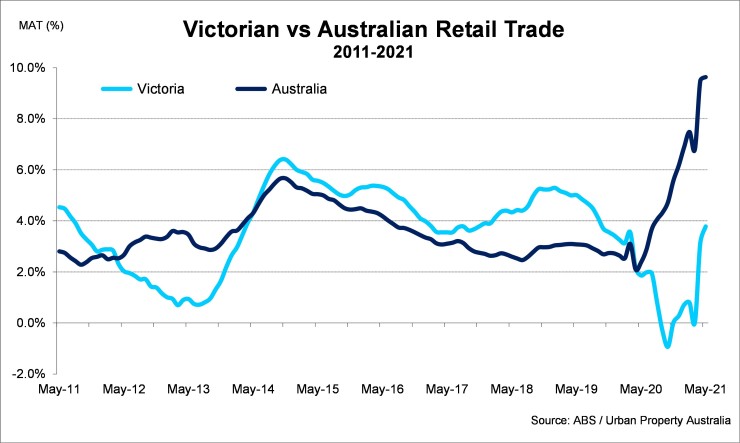
- Over the year to August 2021, annual retail trade in Victoria grew by its highest level since 2019, having steadily increased since retail trade contracted in September and October 2020;
- Online retail trade in Australia continues to gradually take a larger share of overall spending making up 15% of total retail sales, an all-time high.
Retail Market Summary
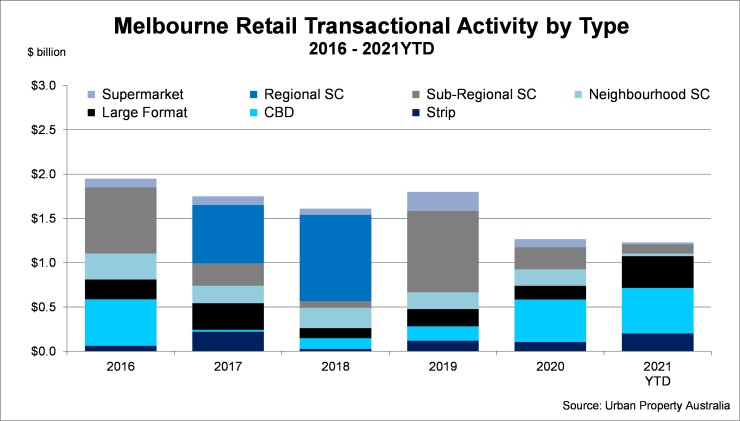
Investment activity in the Victorian retail property sector has already surpassed $1.7 billion in 2021 to date, its second highest annual level in five years. Despite the increased sales activity, yields continued to soften for the majority of retail asset types over the 12 months to September 2021 affected by the uncertainty of the behaviour of consumers post-pandemic and the growth of e-commerce. Over the year to August 2021, annual retail trade in Victoria grew by its highest level since 2019, having steadily increased since late 2020.
Sales Volume/Yields
Having reached a decade low of transactional volume in 2020, Melbourne property sales have already surpassed $1.7 billion in 2021 to date, already the second highest annual level in five years. Boosted by a number of major transactions, sub-regional shopping centres accounted for 37% the total volume of retail property sales volume. Interestingly, despite the challenges facing the precinct, CBD-based assets accounted for 29% of the total volume of retail property sales in Melbourne. Over 2021 to date, Urban Property Australia research revealed that domestic REITS, unlisted funds and syndicates accounted for 47% of the volume of Victorian retail property. Offshore groups purchased 31% of retail property assets sold this year, their highest proportion of transactions since 2016. Domestic private investors accounted for 21% of retail properties sold in 2021.
Yields have continued to soften for the majority of retail asset types over the 12 months to September 2021 affected by the uncertainty of the behaviour of consumers post-pandemic and the growth of e-commerce. Over the 12 months to September 2021, yields of Regional shopping centres have expanded the greatest, impacted the changing consumer trends and lockdowns. In contrast, yields for Neighbourhood shopping centres have tightened over the 12 months to September 2021 as investors increasingly seek assets which are focused on non-discretionary spending. Yield for large format assets have remained steady over the past 12 months boosted by the continued strong trading performance of the assets through the pandemic.

Demand
The Australian retail sector has been buoyed by the effective management of the pandemic and a beneficiary of the largest stimulus package in Australian history. Households are spending their savings accumulated during the COVID-19 period, and retail trade is increasing. Furthermore, overseas travel is unlikely until 2022 and therefore a potential $60 billion per annum normally spent by Australians on overseas travel is likely to be spent domestically. Continued spending by Australians and further support from the Federal Government on job creation will continue to drive the recovery in the retail sector.
Over the year to August 2021, annual retail trade in Victoria grew by 5.4%, its highest level since June 2019, having steadily increased since retail trade contracted in September and October, affected by the Victorian lockdown. In comparison, Australian annual retail trade grew by 7.1% as at August 2021, double the 10-year average.
Although retail trade grew in Victoria has recovered through 2021, the variance of the performance of the individual retail sub-sectors illustrates the impact of the pandemic with retail trade for cafes and restaurants 9% higher than levels last year whereas retail trade for department stores having increased by 2%.
Online retail trade in Australia continues to gradually take a larger share of overall spending. According to the ABS, as at August 2021, online sales made up 15% of total retail sales with Australian online sales with Australian consumers have spent approximately $37 billion online over the 12 months.

Retail Strips
Total vacancy of Melbourne’s prime retail strips has risen to all-time highs with around 12% of all shops vacant. The vacancy levels of Bridge Road, Richmond is the highest at 20% with elevated vacancy rates at Chapel Street, South Yarra (19%), Fitzroy Street, St Kilda (13%) and Lygon Street, Carlton (20%).
The food and beverage sector increased its presence across the strips, growing in the majority of the precincts however a number of fashion retailers have vacated the prominent strips, impacted by store rationalisation and the growing influence of e-commerce.
With many strips having been re-discovered by locals now working from home, some retailers have successfully adjusted to the changing consumer trends. The elevated vacancy levels and rationalisation of some retailers has resulted in rental levels easing with some landlords also offering flexible lease terms and incentives to attract new occupiers.
The retail sector has improved at a remarkable pace and well beyond any forecasts. When looking at spending patterns of discretionary versus non-discretionary goods, the onset of COVID-19 drove the panic buying of food and beverage items and a hiatus in non-discretionary spending due to the lockdown period and resultant store closures. Consequently, non-discretionary spending declined whereas discretionary spending has increased. Now that more normalised spending patterns have emerged and if the economic recovery continues to gather pace, looking forward, Urban Property Australia expect to see a stabilisation of service-based consumption and a shift towards goods-based consumption moving forward which will benefit the retail strips markets.
Copyright © 2021 by Urban Property Australia All rights reserved. No part of this publication may be reproduced in any form, by microfilm, xerography, electronically or otherwise, or incorporated into any information retrieval system, without the written permission of the copyright owner.


