Sydney – Property & Economic Update
April 14th 2018 | , Urban Property Australia
Sydney is the state capital of New South Wales (NSW) and, with more than 5 million residents, is the most populous city in Australia and Oceania, with more than 5 million residents. Sydney has an advanced market economy with strengths in finance, manufacturing and tourism. A significant number of foreign banks and multinational corporations are attracted to Sydney in part because its time zone spans the closing of business in North America and the opening of business in Europe. In addition to being a leading global financial hub, Sydney is amongst the top 15 most-visited cities in the world.
Economy
State final demand (a general indicator of momentum in the local economy) in NSW grew 3.0% in 2017. Looking ahead, NSW is forecast to be the best performing state economy over the next two years, due to strength in private non-dwelling construction, public infrastructure investment, and positive momentum in business and financial services and tourism. Labour market conditions in NSW remain strong, with employment growing 3.7% in 2017. The NSW unemployment rate fell to 4.8% during 2017, compared to 5.4% nationally. There are, however, some headwinds for NSW as the wealth effect of a rising housing market dissipates. With the housing market cooling, NSW’s AU$73 billion[1] infrastructure pipeline is expected to support solid growth this year and through 2019.
New South Wales set to be the best performing Australian state over the next two years boosted by its AU$73 billion infrastructure pipeline.
[1] Unless otherwise noted, all currencies presented in the Capital Cities section are in Australian dollars.

Office Market
The Sydney CBD office market is Australia’s largest CBD office market, comprising 5.0 million square metres.
Over 2017, vacancy in the Sydney CBD office market decreased from 5.8% to 4.6%, largely driven by office withdrawals for residential development and new infrastructure projects.
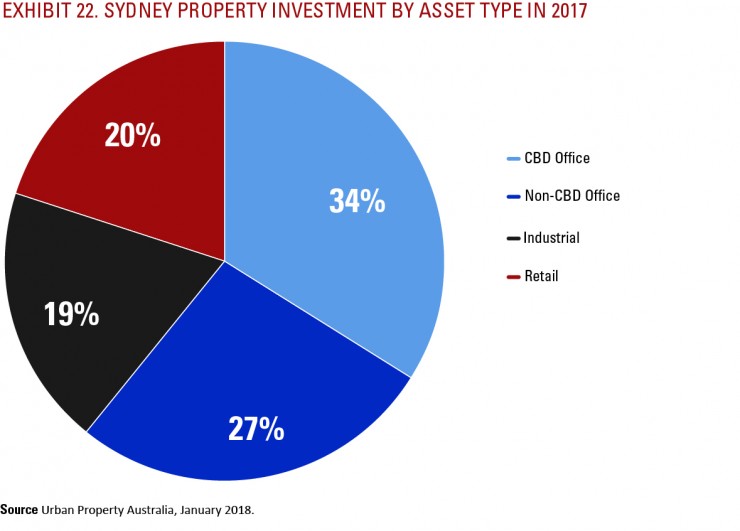
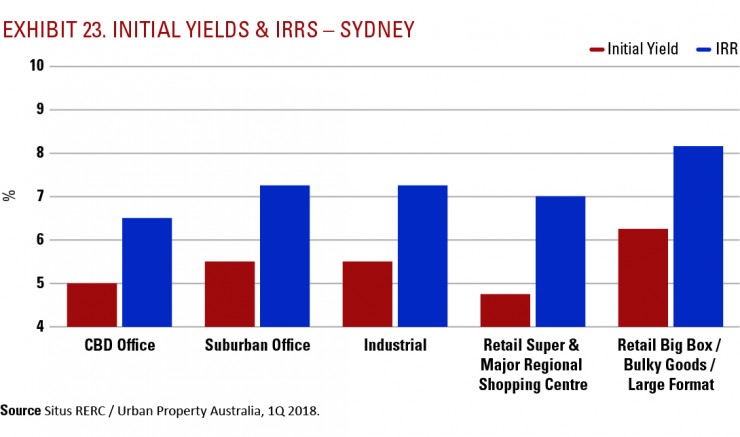
While vacancy has tightened to its lowest level in almost 10 years, the pipeline of new supply remains relatively limited with 130,000 square metres scheduled to be completed over the next two years, compared to the two-year historical average of 325,000 square metres. With vacancy at its lowest level in a decade, Sydney CBD’s prime and secondary gross effective rents have increased 20% and 15% respectively over 2017. Sales activity in the Sydney CBD office market over 2017 totalled $4.7 billion, the second highest level on record. Investment activity by asset type for Sydney can be found in Exhibit 22. The 1Q 2018 Situs RERC/UPA survey results reveal that the average unlevered yield for prime Sydney CBD assets is 5.0% with an average Internal Rate of Return (IRR) of 6.5% (see Exhibit 23 for initial yields and IRRs by property type).
With Sydney’s falling CBD vacancy and strong employment growth recorded across NSW, the current vacancy rates of all of Sydney’s non-CBD office markets are below their respective 10-year averages. Capitalising on the vision of Parramatta becoming ‘Sydney’s second CBD’, the Parramatta office market vacancy rate fell to 3.0%, its lowest level since January 1990. The NSW government has driven leasing demand in Parramatta, accounting for 70% of total leasing activity over 2017, as government agencies decentralise from Sydney CBD to the West. Benefitting from a lack of contiguous vacant options in the CBD and the commitment of major infrastructure projects boosting connectivity, vacancy levels fell across the majority of Sydney’s non-CBD office markets in 2017. Investable stock shortages and pressure to diversify have forced investors to look beyond CBD office markets. Over 2017, prime and secondary yields have compressed in Sydney’s non-CBD office markets as the suburban office market appeals to a wide range of buyers, including residential developers and investors. Responses from the 1Q 2018 Situs RERC/UPA survey reveal that the average unlevered yield for prime Sydney suburban office assets is 5.5% with an average IRR of 7.25%.

Industrial Market
On the back of strong population growth and a strengthening economy, tenant demand volume surpassed the 10-year average over 2017. Tenant demand for Sydney industrial property in 2017 was underpinned by the growth of e-commerce, which boosted activity from retailers, third-party logistics groups and wholesale traders. Following a prolonged period of subdued rental growth, the lack of quality stock and strong demand for prime industrial space resulted in above-average growth for prime rents over 2017, rising 4.5%. Reflecting the confidence in the Sydney industrial market, speculative new development surged in 2017, also lifting new supply levels above average; however, the vast majority of speculative developments were leased prior to completion. While investor demand remains strong, transaction volume dropped significantly in 2017. Although yield compression was relatively modest for prime assets, a lack of investable-grade stock has intensified competition for secondary properties.
According to the January 2018 Situs RERC/UPA survey results, the average unlevered yield for prime Sydney industrial assets is 5.5% with an average IRR of 7.25%.
Retail Market
Although retail spending growth in NSW continued to moderate over 2017, rising 2.6%, but down from 3.3% over 2016, the state continued to outperform the national average (2.5%). While consumer sentiment levels have increased, low wage growth, historically high household debt and easing house price growth are likely to constrain retail spending in coming years. The launch of Amazon to Australia in December 2017 has forced many retailers to refine their business lines and become more specialised. Additionally, landlords continue to face ongoing leasing challenges as retailers consolidate store networks and some retailers have falling into voluntary administration. Population growth will, however, support retail trade. Retail rents in Sydney are expected to remain flat in 2018 across all shopping centre classifications before gradually increasing in 2019 and 2020. NSW accounted for 31% of retail transactions across Australia in 2017 with $2.8 billion sales recorded, above the $1.8 billion transacted in 2016. The 1Q 2018 Situs RERC/UPA survey results reveal that the average unlevered yield for Sydney Super & Major Regional Shopping Centre assets is 4.75% with an average IRR of 7.0%.
Sales of large-format retail centres in NSW totalled $600 million, accounting for 21% of all NSW retail transactions in 2017. Responses from the 1Q 2018 Situs RERC/UPA survey reveal that the average unlevered yield for prime Sydney large-format retail assets is 6.25% with an average IRR of 8.15%.


